Dashboard
The Dashboard provides a real-time visual summary of system backup activity, hardware resource consumption, and storage health. Administrators can monitor all critical metrics from a single screen and detect issues before they impact backup operations.
Dashboard Overview
The screenshot below shows the complete G-Immute Dashboard with all key sections labeled. Each colored border represents a different widget or functional section.
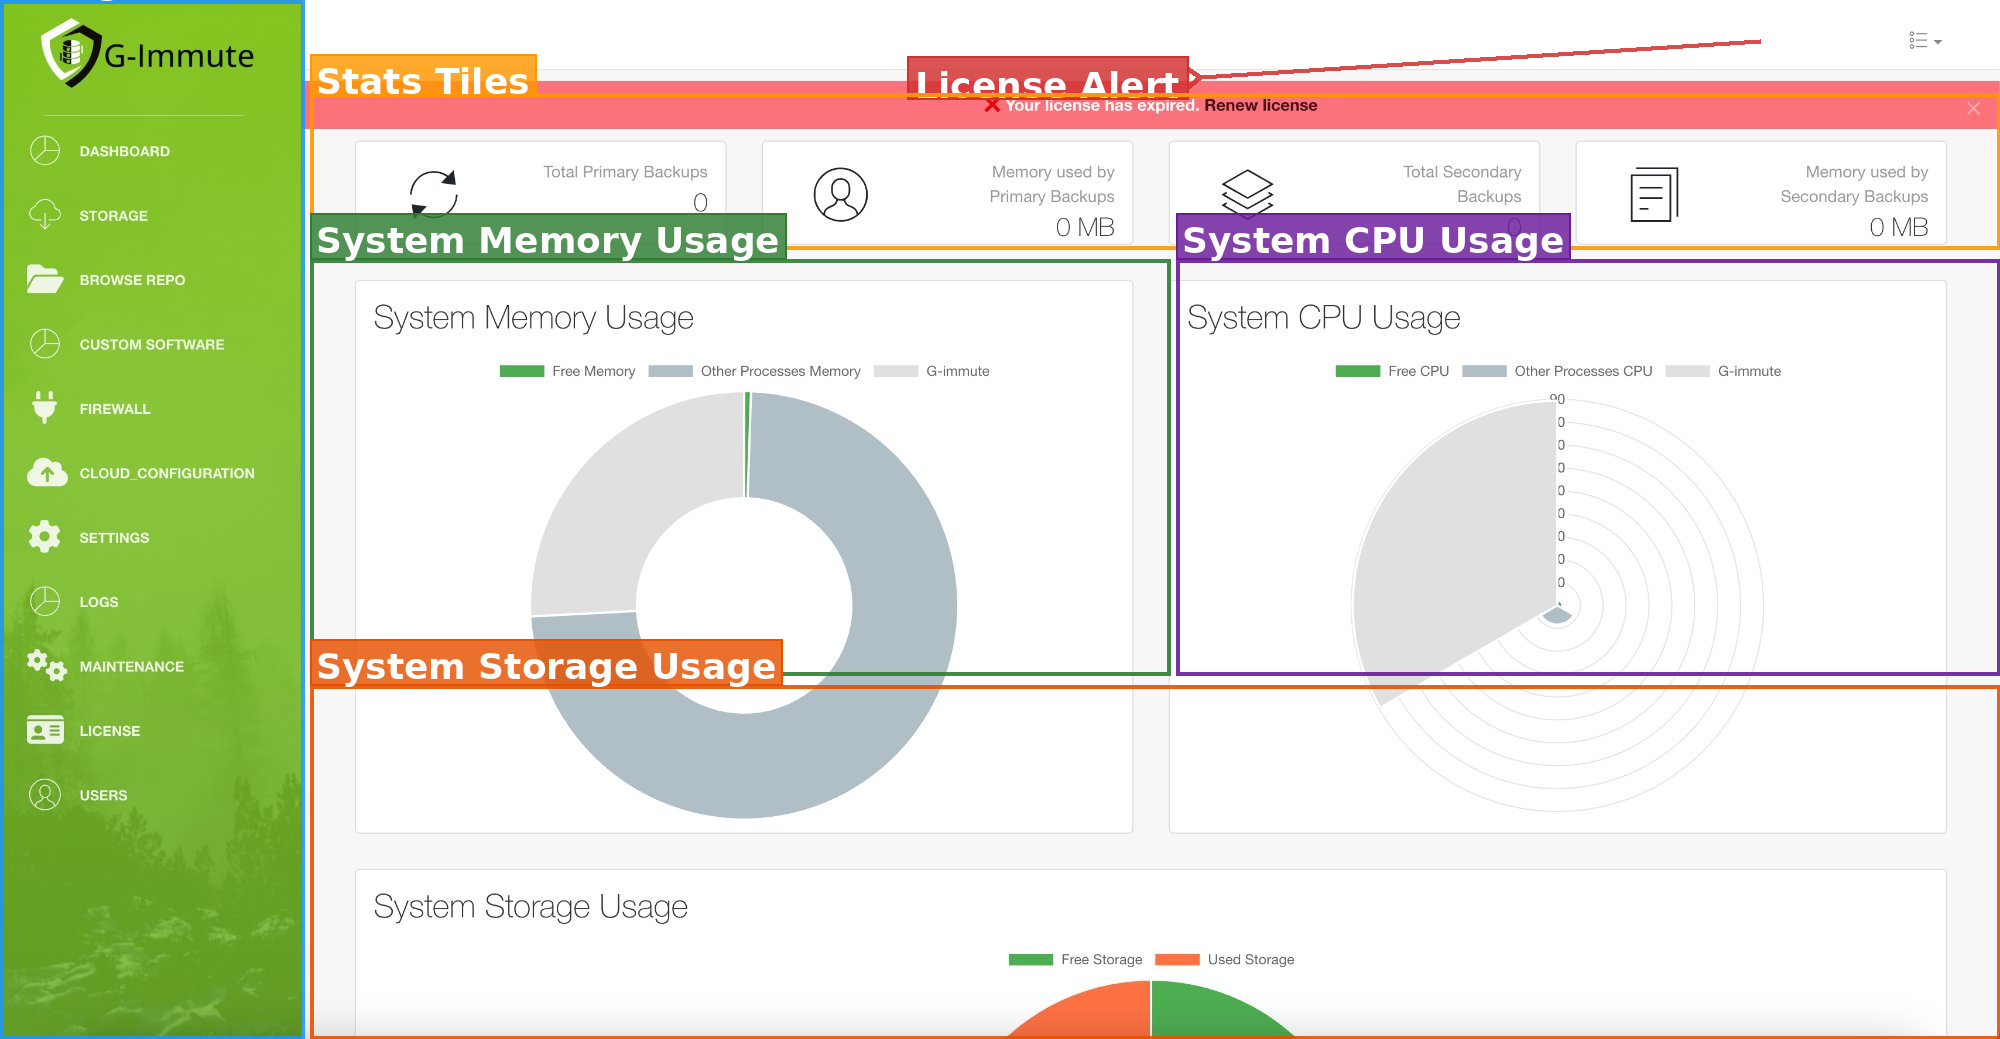
Figure 1 — G-Immute Dashboard (Annotated)
| Element | Description |
|---|---|
| Navigation Sidebar (Blue) | The left panel — access all G-Immute modules from here at any time. |
| License Alert Banner (Red) | Appears when the license has expired. Click Renew license to activate. |
| Statistics Tiles (Orange) | Four tiles showing backup counts and memory usage at a glance. |
| System Memory Usage (Green) | Donut chart — real-time RAM breakdown: Free, OS Processes, G-Immute. |
| System CPU Usage (Purple) | Radar chart — real-time CPU load: Free, OS Processes, G-Immute. |
| System Storage Usage (Orange) | Donut chart — disk space split: Free Storage vs. Used Storage. |
Statistics Tiles
At the top of the Dashboard, four tiles display key backup statistics providing an instant snapshot of backup activity and storage consumption.

Figure 2 — Dashboard Statistics Tiles (annotated)
| Element | Description |
|---|---|
| Total Primary Backups (Blue) | Total primary backup jobs stored or scheduled. A value of 0 means no primary backups have been configured yet. |
| Memory used by Primary Backups (Green) | Disk/memory space consumed by all primary backup data (MB or GB). 0 MB means no primary data is currently stored. |
| Total Secondary Backups (Orange) | Total secondary (replica/offsite) backup jobs. A value of 0 means no secondary backups have been configured. |
| Memory used by Secondary Backups (Purple) | Storage space used by secondary backup data (MB or GB). 0 MB is normal on a freshly installed system. |
All four tiles will show 0 or 0 MB on a new installation. This is expected. Values update as backup jobs are created and run.
System Memory & CPU Usage
The Dashboard displays two real-time performance charts side by side — System Memory Usage and System CPU Usage. These help administrators monitor hardware resource consumption and detect unusual spikes.
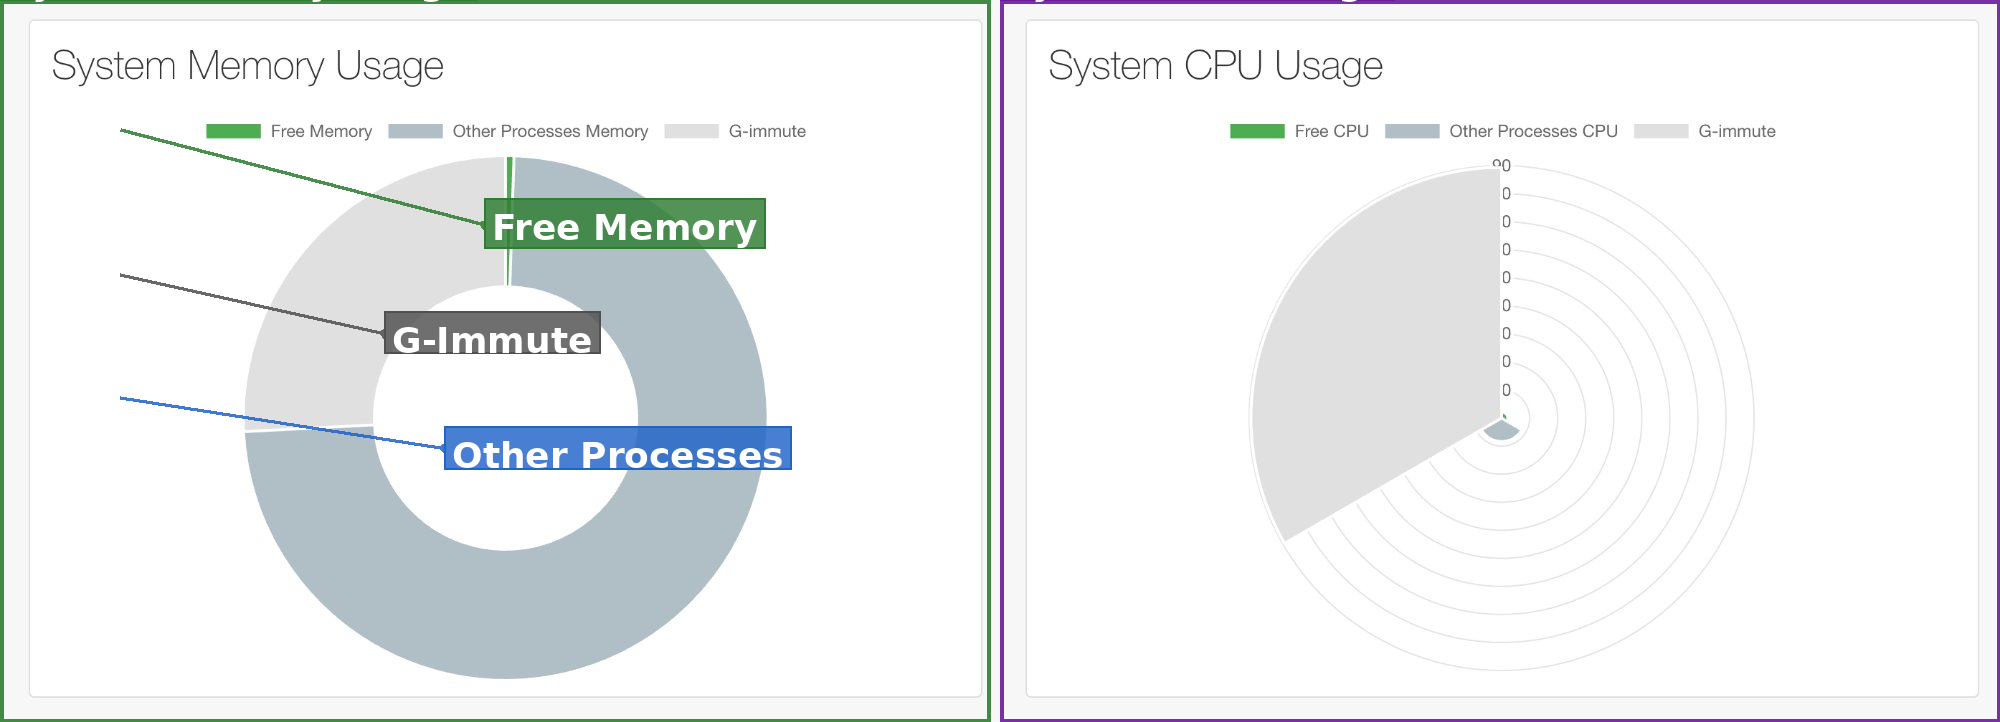
Figure 3 — System Memory Usage (left) and System CPU Usage (right)
System Memory Usage — Donut Chart
The left chart shows how system RAM is distributed across three categories:
| Element | Description |
|---|---|
| Free Memory (Green) | RAM currently unused and available. A large green segment means the system is running comfortably. |
| Other Processes Memory (Grey) | Memory used by background OS processes unrelated to G-Immute. |
| G-Immute (Light Grey) | RAM consumed exclusively by the G-Immute application and its active backup services. |
How to interpret the chart:
- Large green segment = plenty of free memory, system is healthy.
- Large G-Immute segment = heavy backup activity is currently in progress.
- Large Other Processes segment = OS background tasks are consuming significant RAM.
System CPU Usage — Radar Chart
The right chart shows CPU load using a radar (spider web) layout across three categories:
| Element | Description |
|---|---|
| Free CPU (Green) | Idle processor capacity. More green = lighter CPU load on the system. |
| Other Processes CPU (Grey) | CPU used by OS background tasks not related to G-Immute. |
| G-Immute CPU (Light Grey) | CPU used by G-Immute for backup processing, encryption, and data management. |
How to interpret the chart:
- Chart near the center = low CPU load, system running efficiently.
- Chart reaching outer rings = high CPU load, monitor active backup jobs.
- G-Immute segment grows during active backup operations — this is expected.
Both charts update in real time. Refresh the Dashboard page to see the latest data.
System Storage Usage
At the bottom of the Dashboard, the System Storage Usage chart shows total disk space on the G-Immute system. It helps administrators plan capacity and identify when storage is running low before backup jobs fail.
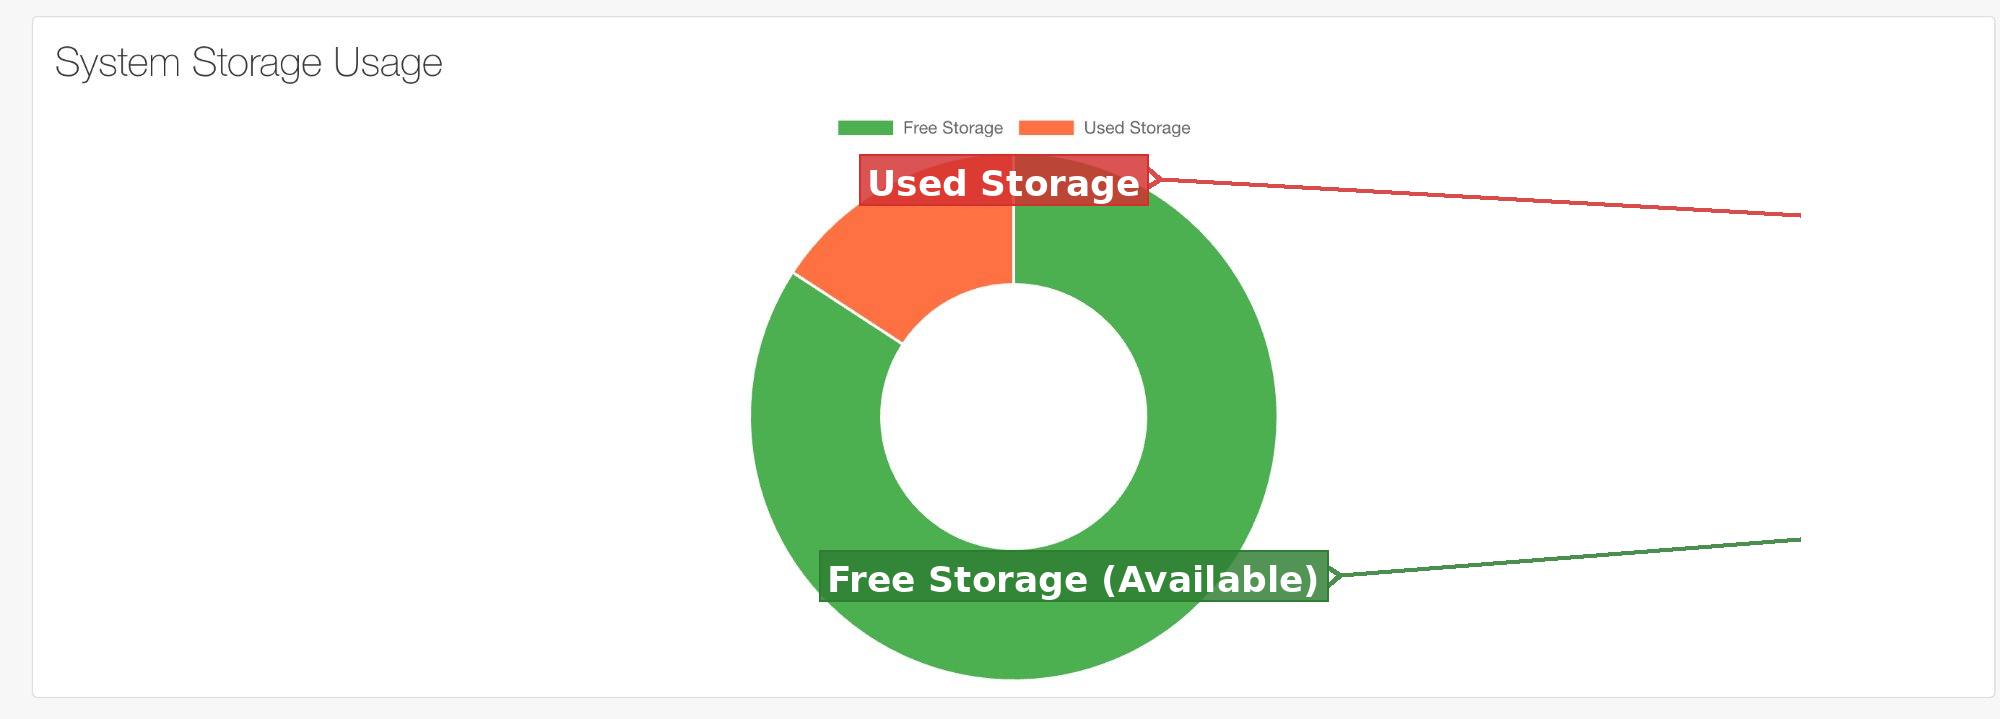
Figure 4 — System Storage Usage Chart
| Element | Description |
|---|---|
| Free Storage (Green) | Available disk space not yet used. A large green segment means ample capacity remains on the system. |
| Used Storage (Orange) | Disk space occupied by backup data, system files, and G-Immute application data. Grows as backups are created. |
Storage Health Guidelines
- Predominantly green chart = storage is healthy, no immediate action needed.
- Orange segment growing past 50% = consider expanding storage or removing old backups.
- Used Storage at 80% or more = take immediate action to prevent backup failures.
Maintain at least 20% free storage at all times. Review the Storage Usage chart regularly, especially after large backup jobs.